A Brief History of r.Virgeel
In the late 80s, I crossed with BrainMaker, a suggestive piece of software that let you play with neural networks. I was working as an architect and I was self-taught in the theory of patterns as formulated by Christopher Alexander. On one side pattern recognition, on the other side patterns in reality. A nice field of research.
At a certain point, let’s say the beginning ’90s, I was ready to take off with a language and code my own tools. Much easier to say, I finally got through a wonderful software library that manages back-propagation networks. Straight, fast, error-prone, wow! I’ve built many many versions of a tool, that was always showing the same definitive fault, paying the necessity to tune parameters and entering self-referral loops.
It was around 2012 that I began thinking about the necessity to develop a plan B in my life (I was working as an architect). Put your skills under a short circuit and your plan B will materialize. In the spring of 2013, the design of the complex of applications necessary to bring r.Virgeel to life began to take shape. It took about one year to collect the data, build the database management, and generate the skeleton of a first possible model. Most of the following two years of development were documented in the Market Mind View free blog (now offline).
The models have been developed since then and I think that it has achieved a mature configuration in the latest months, mid-2017. Then it has been refine and still now it is subject to maintainance. The result of four years of hard work is a model that correlates simultaneously dozens and dozens of inputs, consisting of financial and economic indices such as stock markets, currencies, bonds, rates, commodities, metals, energy and more. The largest of the active neural network models has more than 28 million neurons or nodes. The model is heavily de-parametrised, as it is set up, since design, to enhance the generalization ability of neural networks, in other words, their ability to see, to recognize, to classify. Are you surprised? The software can see? Are we really into Minority Report or Matrix? Can software really see into the future? Well, no. And yes.
Let’s look at it in another way: the neural network always provides the less improbable result, chosen from the archive of possible results it has been trained on. It’s a complex relationship: as these data, this possible diagnosis. This classification. This signal. Neural networks learn from the experience you provide them. They do not calculate the result: they know the result, if someone has taught it to them. Otherwise, they guess, in reverse statistics, the less improbable result. Not the precise result of a calculation, but the less improbable result from its experience database. If you teach rubbish to a network, you get… guess? You get the less improbable rubbish.
In mid-2015, I realized that probably the architectural work, in Italy, was over and the neural works were worth the development. I also realized that the information I was producing was getting sensitive and that induced me to hide from the large public, giving life to the premium spxbot.com website. I mean, I wanted to continue my research and to have interaction with selected interested people, because this interaction is precious. It’s real fuel in the development process. So the site is available under a cheap annual fee because I prefer a selected small club to a vast messy audience.
What is a robo-advisor? It is a software based on artificial intelligence that gives some response to market action. In r.Virgeel’s case, the response is provided by several indicators that mutually confirm the best side of the market to be on.
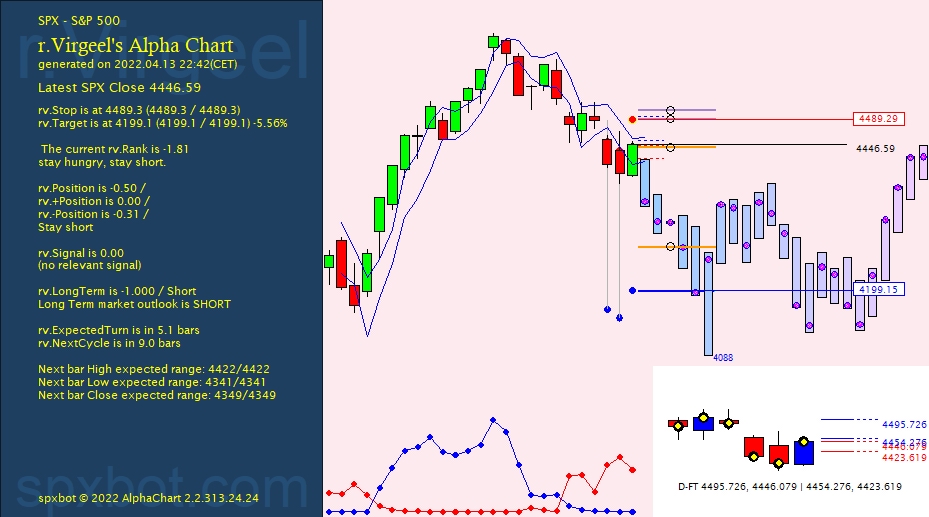
The model calculation includes the following indicators:
- rv.NextBars: Calculates the H/L/C values of the next 24 bars (about a month in the daily model, about six months in the weekly model, and two years in the monthly model).
- rv.Position: Determines the optimal market position in three distinct values: overall using all data, then using only positive day data, and finally using only negative day data to confirm and reduce possible ambiguities.
- rv.Target: Calculates the target of the current movement.
- rv.Stop: Calculates the stop value below which the position should be closed.
- rv.BuySell: The initial version of the Buy/Sell signal generator, which evolved into rv.Position over time.
- rv.ExpectedTurn: Calculates how many bars are left until the next reversal.
- rv.NextCycle: Calculates how many bars are left until the start of the next cycle (from low to low).
- rv.LongTerm: Calculates the long-term attitude of the market.
These indicators can be seamlessly integrated with traditional technical analysis indicators, providing a comprehensive arsenal for analyzing market conditions and anticipating immediate future events.
A sample of the daily chart with indicators in action

Please read the blog for a wider explanation of the indicators’ behaviour, origin, and development.
